Filebeat, Logstash, Elasticsearch, Kibana, Nginx
We will use Filebeat, Logstash, Elasticsearch and Kibana to visualize Nginx access logfiles.
Create the x509 Certificate
As I have all running on one server I use as the SSL common name localhost.
mkdir -p /usr/local/etc/pki/tls/certs
mkdir -p /usr/local/etc/pki/tls/private
cd /usr/local/etc/pki/tls
openssl req -subj '/CN=localhost/' -x509 -days 3650 -batch -nodes -newkey rsa:2048 -keyout private/beat.key -out certs/beat-cacert.crt
The beat-cacert.crt will be copied to all computer you want to send logs from.
Install and configure Elasticsearch
pkg install elasticsearch2We only change one line in the config file to make sure only localhost can connect to elasticsearch:
network.host: localhostEnable it with:
sysrc elasticsearch_enable="YES"
Start it with:
service elasticsearch start
Install and configure Logstash
Logstash will collect all logs from filebeat, make filtering on it and will forward it to elasticsearch.
pkg install logstash
input {
        beats {
                port => 5044
                ssl => true
                ssl_certificate => "/usr/local/etc/pki/tls/certs/beat-cacert.crt"
                ssl_key => "/usr/local/etc/pki/tls/private/beat.key"
        }
}
filter {
        if [type] == "syslog" {
                grok {
                        match => { "message" => "%{SYSLOGTIMESTAMP:syslog_timestamp} %{SYSLOGHOST:syslog_hostname} (%{DATA:syslog_program}(?:\[%{POSINT:syslog_pid}\])?: %{GREEDYDATA:syslog_message}|%{GREEDYDATA:syslog_message})" }
                        add_field => [ "received_at", "%{@timestamp}" ]
                        add_field => [ "received_from", "%{@source_host}" ]
                }
                date {
                        match => [ "syslog_timestamp","MMM  d HH:mm:ss", "MMM dd HH:mm:ss", "ISO8601" ]
                }
                syslog_pri { }
        }
        if [type] == "web_access_nginx" {
                grok {
                        match => [
                                "message", "%{IPORHOST:http_host} %{IPORHOST:clientip} \[%{HTTPDATE:timestamp}\] \"(?:%{WORD:verb} %{NOTSPACE:request}(?: HTTP/%{NUMBER:httpversion})?|%{DATA:rawrequest})\" %{NUMBER:response} (?:%{NUMBER:bytes}|-) %{QS:referrer} %{QS:agent} %{NUMBER:request_time:float} %{NUMBER:upstream_time:float}",
                                "message", "%{IPORHOST:http_host} %{IPORHOST:clientip} \[%{HTTPDATE:timestamp}\] \"(?:%{WORD:verb} %{NOTSPACE:request}(?: HTTP/%{NUMBER:httpversion})?|%{DATA:rawrequest})\" %{NUMBER:response} (?:%{NUMBER:bytes}|-) %{QS:referrer} %{QS:agent} %{NUMBER:request_time:float}"
                        ]
                }
                date {
                        match => [ "syslog_timestamp","MMM  d HH:mm:ss", "MMM dd HH:mm:ss", "ISO8601" ]
                }
                geoip {
                        source => "clientip"
                        target => "geoip"
                        database => "/usr/local/etc/logstash/GeoLiteCity.dat"
                        add_field => [ "[geoip][coordinates]", "%{[geoip][longitude]}" ]
                        add_field => [ "[geoip][coordinates]", "%{[geoip][latitude]}"  ]
                }
                mutate {
                        convert => [ "[geoip][coordinates]", "float"]
                }
        }
}

output {
        stdout { codec => rubydebug }

        elasticsearch {
                hosts => [ "localhost:9200" ]
                sniffing => true
                manage_template => false
                index => "%{[@metadata][beat]}-%{+YYYY.MM.dd}"
                document_type => "%{[@metadata][type]}"
        }
}
We need to download a current GeoIP database:
cd /usr/local/etc/logstash
curl -O "http://geolite.maxmind.com/download/geoip/database/GeoLiteCity.dat.gz"
gunzip GeoLiteCity.dat.gz
Load Kibana Dashboards
Now we need to import some data to use Kibana Dashboards:
cd
curl -L -O https://download.elastic.co/beats/dashboards/beats-dashboards-1.2.3.zip
unzip beats-dashboards-1.2.3.zip
cd beats-dashboards-1.2.3
sed -i '' -e "s#/bin/bash#/usr/local/bin/bash#" load.sh
./load.sh
Load Filebeat Index Template to Elasticsearch:
curl -XPUT 'http://localhost:9200/_template/filebeat?pretty' -d '
{
  "mappings": {
    "_default_": {
      "_all": {
        "enabled": true,
        "norms": {
          "enabled": false
        }
      },
      "dynamic_templates": [
        {
          "template1": {
            "mapping": {
              "doc_values": true,
              "ignore_above": 1024,
              "index": "not_analyzed",
              "type": "{dynamic_type}"
            },
            "match": "*"
          }
        }
      ],
      "properties": {
        "@timestamp": {
          "type": "date"
        },
        "message": {
          "type": "string",
          "index": "analyzed"
        },
        "offset": {
          "type": "long",
          "doc_values": "true"
        },
        "geoip"  : {
          "type" : "object",
          "dynamic": true,
          "properties" : {
            "location" : { "type" : "geo_point" }
          }
        }
      }
    }
  },
  "settings": {
    "index.refresh_interval": "5s"
  },
  "template": "filebeat-*"
}
'
You should see:
{
  "acknowledged" : true
}
Configure NGINX to log in defined format
Add in the nginx configuration in the http section:
...
    log_format kibana '$http_host '
                    '$remote_addr [$time_local] '
                    '"$request" $status $body_bytes_sent '
                    '"$http_referer" "$http_user_agent" '
                    '$request_time '
                    '$upstream_response_time';
...
And for each virtualhost you need this logging define:
access_log /path-to-directory/logs/access.log kibana;Reload the nginx config with:
service nginx reload
Install and configure Filebeat
pkg install filebeat
filebeat:
  prospectors:
    -
      paths:
        - /var/log/auth.log
        - /var/log/messages
      input_type: log
      document_type: syslog
    -
      document_type: web_access_nginx
      input_type: log
      paths:
        - /usr/home/http/poudriere/logs/access.log

output:
  logstash:
    hosts: ["localhost:5044"]
    bulk_max_size: 1024
    tls:
      certificate_authorities: ["/usr/local/etc/pki/tls/certs/beat-cacert.crt"]

shipper:

logging:
    rotateeverybytes: 10485760 # = 10MB
Verify the format of the file with:
filebeat -configtest -e -c /usr/local/etc/filebeat.yml
Enable Filebeat with:
sysrc filebeat_enable="YES"
And start it with:
service filebeat start
It should now directly start to deliver logfile information defined in section prospectors. You can test it with:
curl -XGET 'http://localhost:9200/filebeat-*/_search?pretty'
If you see something like this everything is fine:
{
  "took" : 1,
  "timed_out" : false,
  "_shards" : {
    "total" : 20,
    "successful" : 20,
    "failed" : 0
  },
  "hits" : {
    "total" : 18157,
    "max_score" : 1.0,
    "hits" : [ {
      "_index" : "filebeat-2016.08.03",
      "_type" : "syslog",
      "_id" : "AVZcJLZL5UZfyQchYySN",
...
Setup NGINX to deliver Kibana
The kibana webinterface should be available at https://elk.your-domain I use the following configuration:
upstream kibana {
    server 127.0.0.1:5601;
}

server {
    include snipets/listen.conf;

    server_name elk._your-domain_;

    # Include location directive for Let's Encrypte ACME Challenge
    include snipets/letsencrypt-acme-challange.conf;

    add_header Strict-Transport-Security "max-age=15768000; includeSubdomains; preload" always;

    access_log /_path-to-your-domain_/logs/access.log;
    error_log /_path-to-your-domain_/logs/error.log;

    auth_basic "Restricted Access";
    auth_basic_user_file /_path-to-your-domain_/.htpasswd;

    location / {
        proxy_pass http://kibana;
        #proxy_redirect http://kibana/ https://elk._your-domain_;
        proxy_http_version 1.1;
        proxy_set_header Upgrade $http_upgrade;
        proxy_set_header Connection 'upgrade';
        proxy_set_header Host $host;
        proxy_cache_bypass $http_upgrade;
    }
}
Make sure you define a user:
htpasswd -c /_path-to-your-domain_/.htpasswd _your-user_
Reload nginx:
service nginx reload
Install and Configure Kibana
Install kibana with:
pkg install kibana45
sysdc kibana_enable="YES"
Configure kibana to only listen on localhost:
server.host: "localhost"Start kibana with:
service kibana start
Now access the webinterface https://elk.your-domain and enter your username and password you defined before.
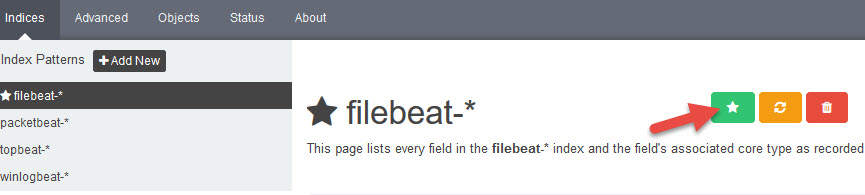
At first you must select a default Pattern:
Click on the left site on filebeat-*
then select the default button:
| Aug 06 | Filebeat, Logstash, Elasticsearch, Kibana, Nginx | 2 min read |
| Mar 10 | Apache | 5 min read |
| Feb 03 | Letsencrypt | 3 min read |
| Nov 15 | Migrate system from i386 (32-bit mode) to amd64 (64-bit mode) | 4 min read |
| Mar 12 | Samba 4 | 1 min read |